Introduction
Thanks to @xmcp ‘s xmpaint, we are now able to solve connected graph problems in a visual way.
We would be giving some advices on creating visually compelling logos and figures through xmpaint.
xmpaint is an application, fully designed to comply to the writing and programming standards of oiers, who describe vertices and edges in their special ways. This would not be a problem to oiers, though.
- Connected graphs from U to V with no weight is written as
U V - Bi-connected graphs connecting U and V is written as two connected edges from U to V and from V to U.
- Connected graphs from U to V with weight W is written as
U V W - Similarly, bi-connected graphs with weight is described similarly.
Tricks
To create strange but aesthetically acceptable logos, we might attempt to use the following tricks:
- Repetition
- Randomization
- Emphasis
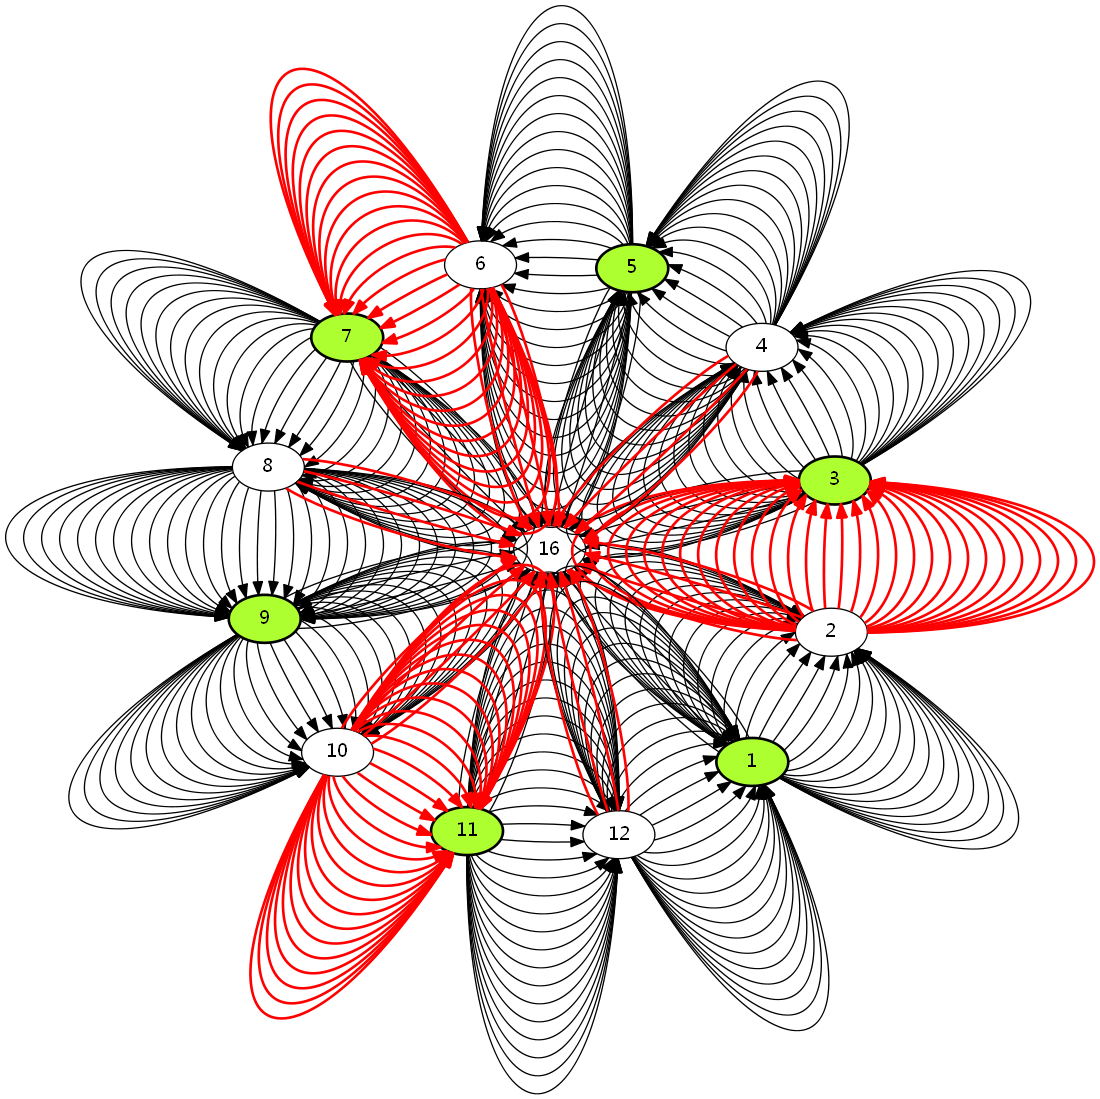
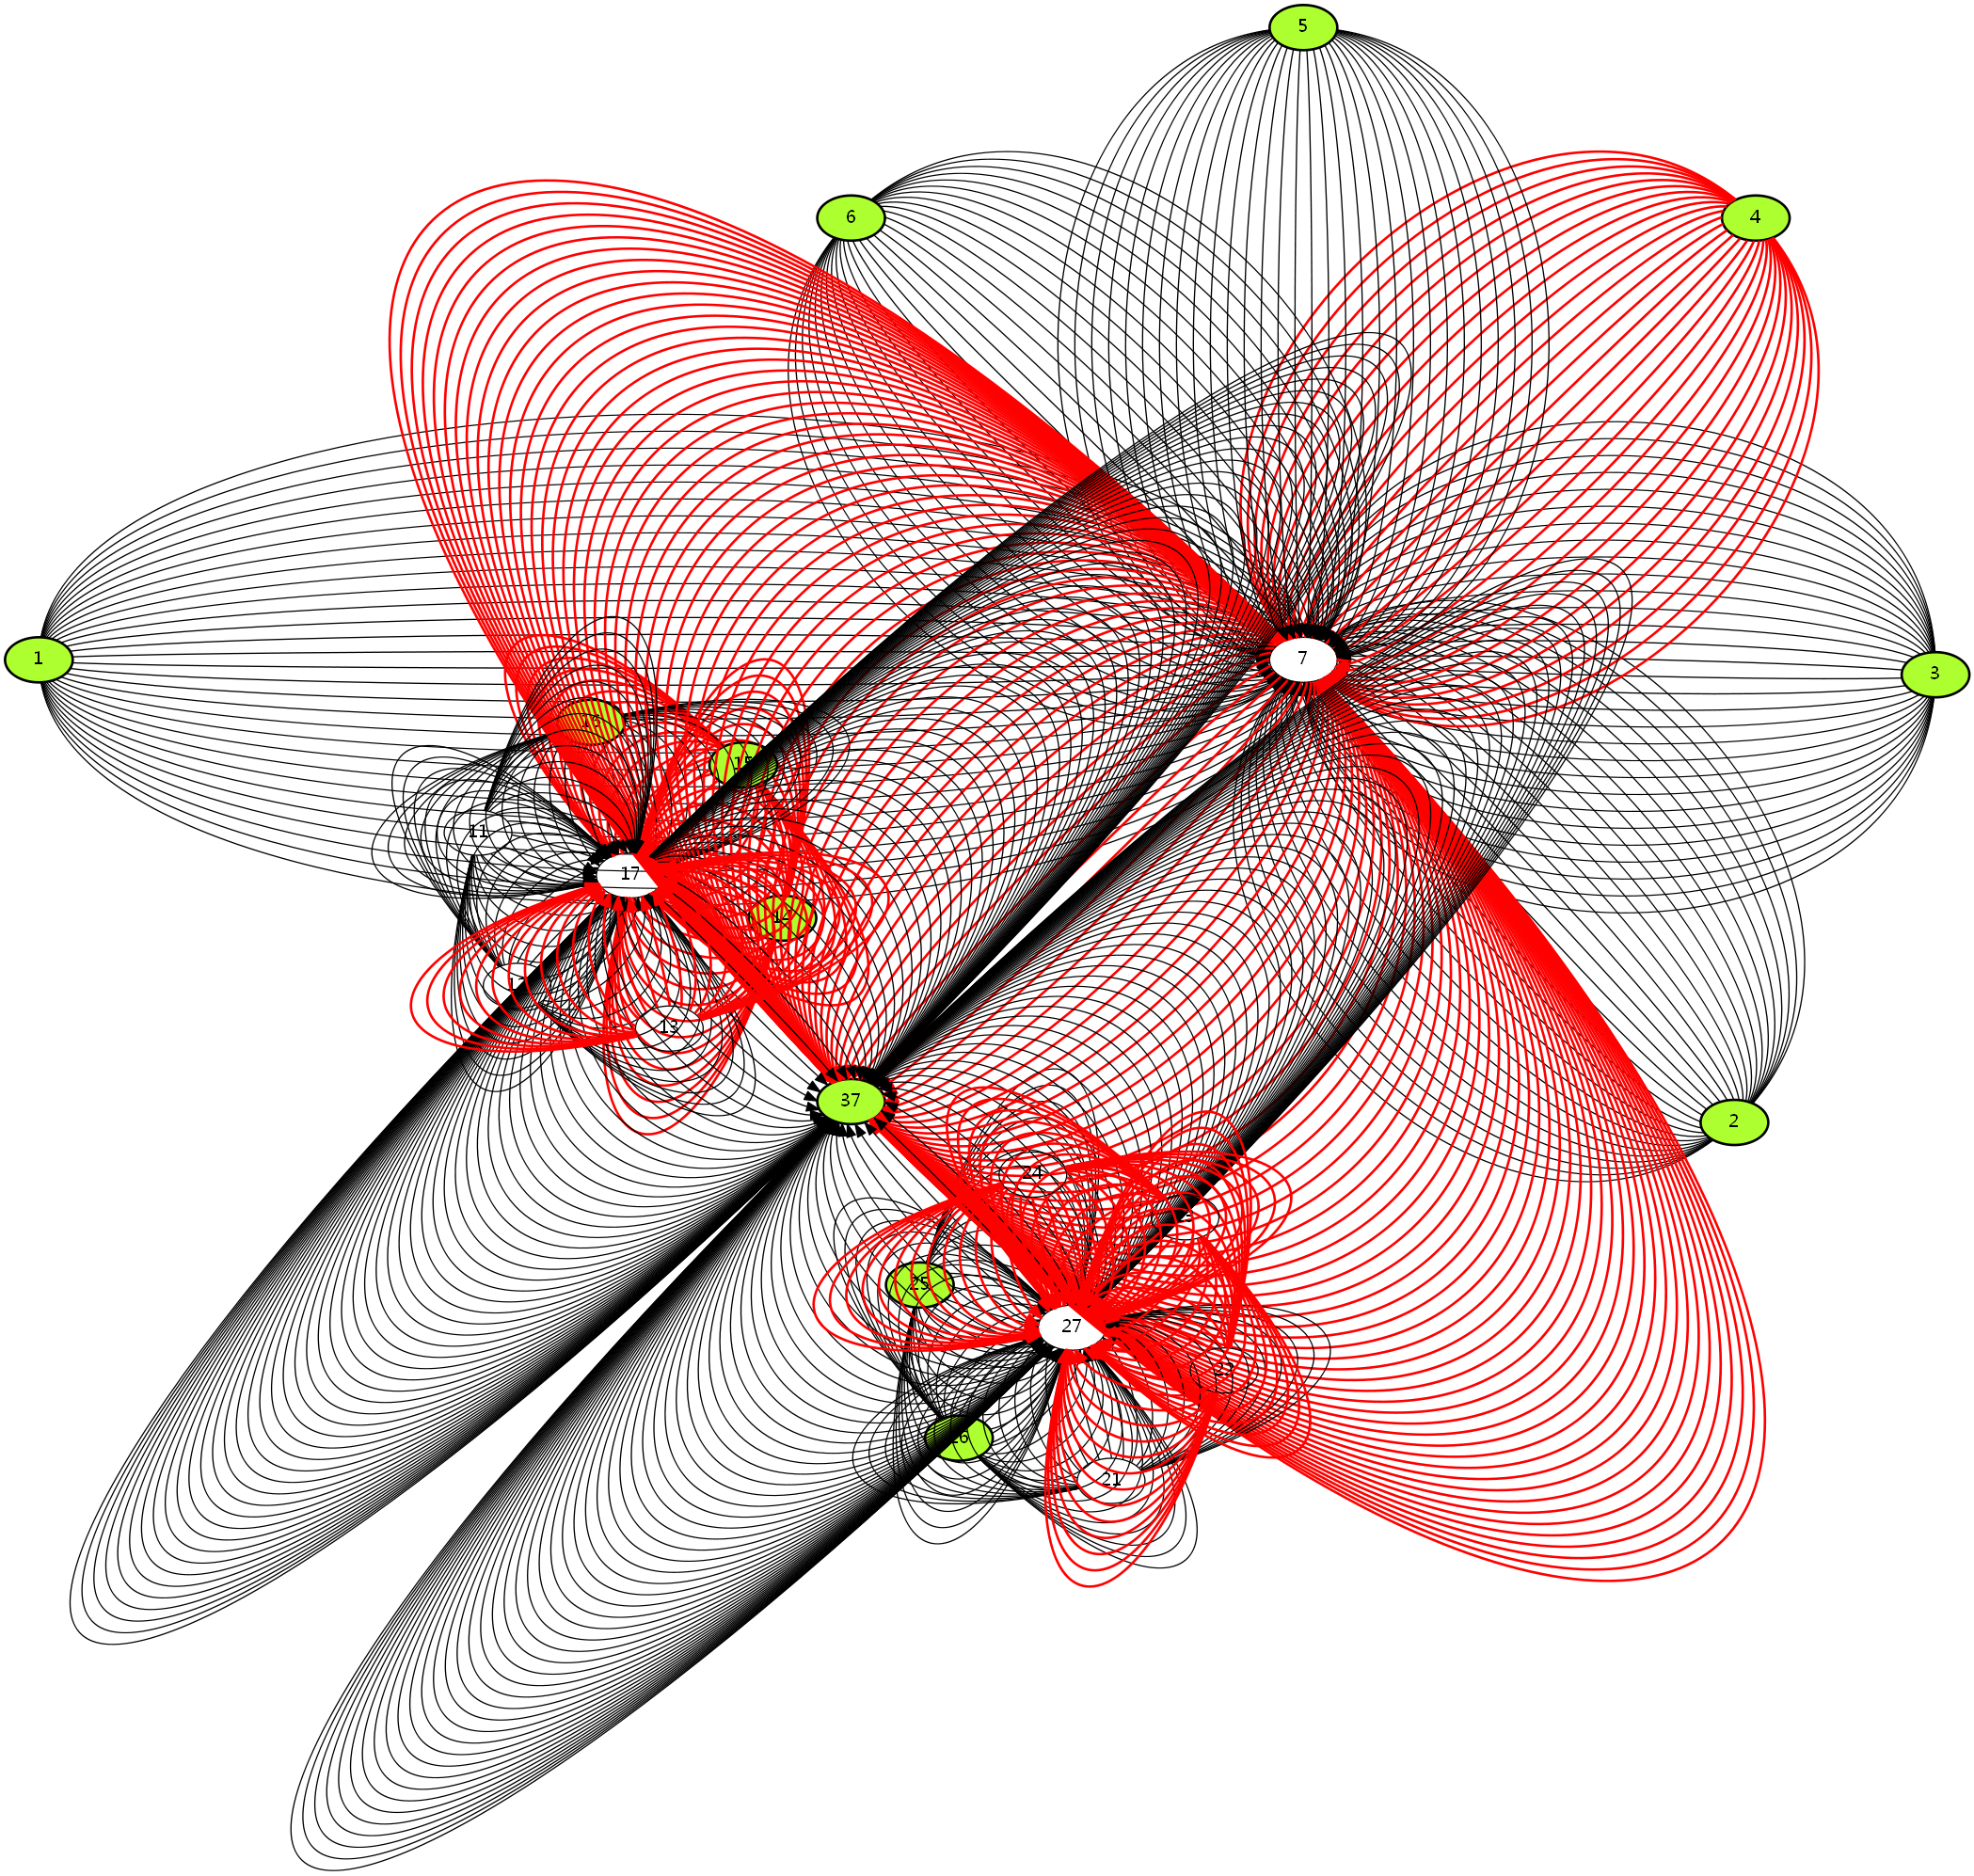
As of repetition, repeating edge connection between two edges may eventually form a circle. Under different renderers, this may vary.
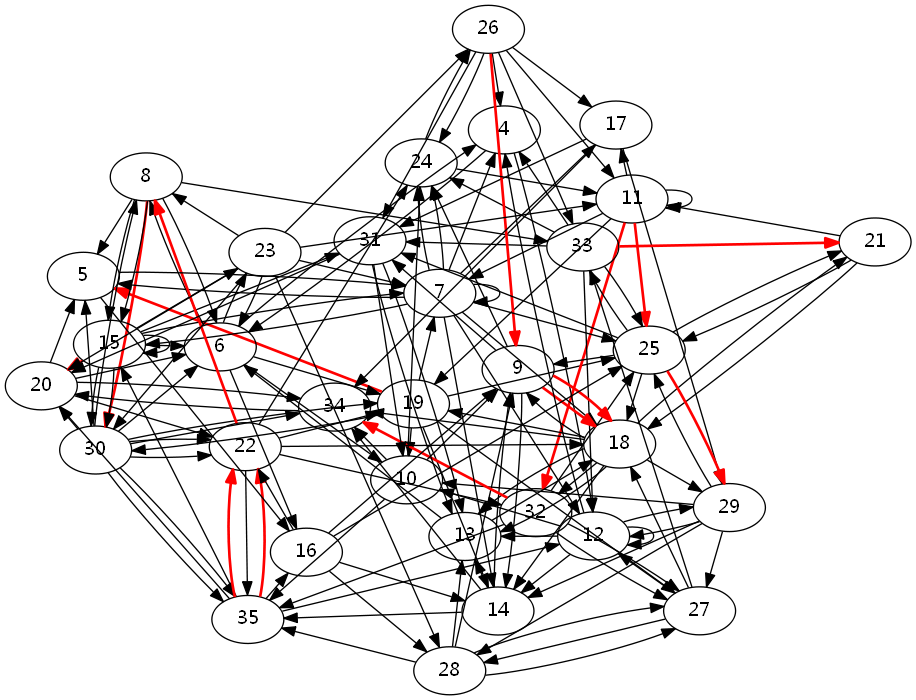
As of randomization, I shall provide an example code in Python, which can directly generate data from the sample.
import random
f = open('out.txt', 'w', encoding = 'utf-8')
u = range(1, 60)
for i in range(1, 1000):
  j = random.choice(u)
  k = random.choice(u)
  w = random.choice(range(1, 1300))
  f.write('%d %d %d\n' % (j, k, w))
f.close()
Emphasis can be achieved by highlighting the specific edges or specific vertexes. Vertexes are highlighted green, and edges are highlighted red. No other colour options are provided, which is not necessary for the originally desired purposes of this program.
Samples
Some samples done when being sleepless.
I strongly suggest oiers not to do this when solving problems. This is quite obscure and time-compelling, which may lead you to burst zeroes.